THE DATAVERSE
3D Code Visualization: Navigate Your Codebase
The DataVerse renders your code as an interactive 3D graph. Each node is a function, class, or file. Each edge is a call or import. Zoom in, rotate, select elements, and see their relationships.
Why Visualize Code?
In a text editor, every function looks the same. You can't tell if it's called once or a thousand times just by reading it.
In the DataVerse, heavily-called functions have more connections—they're visibly central. Functions with no callers sit isolated at the edges. Tightly-coupled modules cluster together.
Structure becomes spatial. You see patterns instead of inferring them.
Navigate Your Code in 3D
Zoom Levels
Start at the full-codebase overview. Zoom into a module cluster. Keep zooming to see individual functions. Each level shows appropriate detail.
Visible Connections
Edges show call relationships and imports. Hover over a node to highlight its connections. Click to see detailed relationship data.
Interactive Selection
Click any node to see its full profile. Highlight all connections. Trace paths from any element to any other. Your code, explorable.
Smart Clustering
Code elements automatically cluster by module, type, or relationship strength. See natural boundaries emerge. Identify tightly coupled subsystems at a glance.
Information Encoded in Every Pixel
The DataVerse isn't just beautiful—it's information-dense. Every visual element carries meaning.
Node Size
Larger = more code. See complexity at a glance.
Node Brightness
Brighter = more connections. Hubs glow intensely.
Node Color
Type, module, or custom grouping. Instant differentiation.
Line Thickness
Thicker = stronger relationships.
Spatial Distance
Closer = more related. Clusters reveal coupling.
Edge Position
Orphans drift to edges. Dead code becomes visible.
Analysis Lens: See Patterns at a Glance
Filter the entire visualization by code characteristics. One click highlights what matters.
Potentially Dead
Functions with zero callers. Code that exists but nothing uses. Safe to investigate for removal.
Entry Points
Where execution begins. Functions called from outside but that call into your codebase. API endpoints, event handlers, main functions.
High Traffic
Heavily-used functions. Many callers, many dependencies. Change these carefully—blast radius is large.
High Complexity
Functions with high cyclomatic complexity. Hard to test, hard to maintain. Prime candidates for refactoring.
Leaf Nodes
Functions that call nothing else. Pure utilities, helpers, final operations. Often the simplest code to understand.
Async/Race Risk
Concurrent code patterns. Async functions, promises, callbacks that might race. Areas requiring careful synchronization.
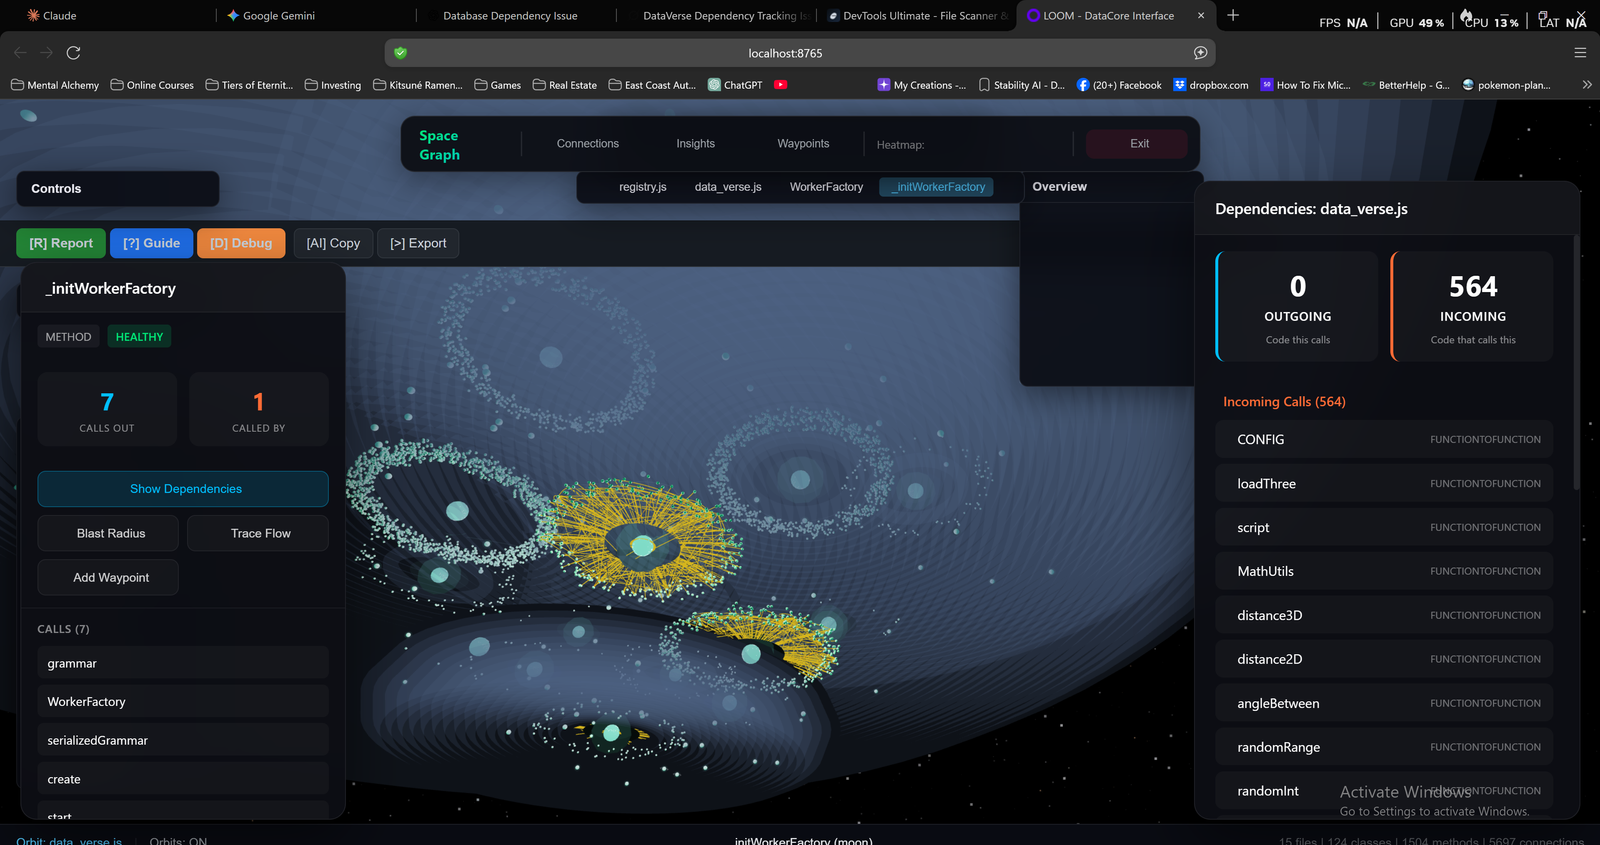
Deep Dive on Any Element
Click any node to see its complete profile and available actions.
Node Inspector Panel
Every node shows its type (function, class, method) and health status. You see exactly how many functions call it and how many it calls out to.
From the inspector, you can:
- Show Dependencies — Highlight everything this element depends on
- Blast Radius — See what would break if you changed this
- Trace Flow — Follow the call chain in either direction
- Add Waypoint — Mark important nodes for later reference
What You'll Discover
The God Object
That one class with 200 connections? It's the supernova in your DataVerse—impossible to miss. You'll know exactly where technical debt concentrates.
Dead Code Drift
Unused functions float to the edges, disconnected from the main graph. Identify them instantly. Delete with confidence.
Architectural Layers
Well-architected code shows clear layers and clusters. Spaghetti shows... spaghetti. The visualization reveals what documentation hides.
Change Impact
Select an element, watch connections light up. See your blast radius before you make any change.
Built for Real Codebases
See Your Code Like Never Before
The DataVerse doesn't just show you your code—it shows you your code's soul.
Free tier available. No credit card required.